
Growing Up With Media:
Mental Health and Psychosocial Indicators
April 2013
Researchers, public policy officials, and the general public as a whole have long been concerned about the consequences of youth’s exposure to violence and sex in the media. Recent studies have documented the explosion of different types of media available to youth 1, 2 and the widespread presence of violence in these media outlets.3
This is the fifth in a series of 6 bulletins summarizing the methodology for and findings from the Growing up with Media (GuwM) Study. GuwM is a longitudinal survey of 1,586 youth aged 10-15 years at baseline. Data were collected initially between August – September, 2006, again between November, 2007 – January, 2008, and finally between August – November, 2008. The survey protocol was reviewed and approved by the Centers for Disease Control and Prevention Institutional Review Board (IRB).
What is Growing up with Media?
- GuwM is a longitudinal online survey of a national sample of 1,586 young people, ages 10 to 15 years at Wave 1.*
- Because exposures and experiences online were a main interest of the survey, youth were required to have used the Internet at least once in the past 6 months. The inclusion criteria were purposefully broad to ensure a wide variability in internet experience and exposure.
- Caregivers were members of the Harris Poll Online (HPOL) opt-in panel and residents of the U.S.
- Caregivers first completed a short online survey (approximately 5 minutes).
- With caregiver permission, youth completed an online survey; approximately 25 minutes.
- The sample was purposefully balanced on youth age and sex.
- Adult participants received $10 and youth a $15 gift certificate at Waves 1 and 2. To increase the response rate at Wave 3, adult participants received $20 and youth a $25 gift certificate.
- Data were collected across three time points:
- Wave 1: August – September, 2006
- Wave 2: November, 2007 – January, 2008
- Wave 3: August – November, 2008
- Data were weighted to match the U.S. Population of adults with children between the ages of 10 and 15 years. Adults were the weighting target because they were the recruitment target.
- Propensity scoring was applied to adjust for the adult’s (i.e., recruitment target) propensity to be online, in HPOL, and to respond to the particular survey invitation.
- A full report on the methodology of the GuwM study is posted online at: http://innovativepublichealth.com/guwm-methodology-bulletin.
*As a result of data cleaning activities, the final sample size for Wave 1 is 1,581 (See the Methodological Details bulletin for more details).
As the Internet and other media types become increasingly prominent in the lives of today’s youth, questions have been raised regarding what impact this has on the mental health and well being of youth. To better understand how these things co-relate, several indicators of mental health and problem behaviors were included in the Growing up with Media survey, including: caregiver-child relationships, social support, one’s propensity to respond to stimuli with anger, substance use, school performance and learning disabilities, depressive symptomatology, and unprotected sexual behavior.
In this report, we provide a general overview of youth mental health and problem behaviors by age and biological sex, as well as trends across time (i.e., Wave).
The report includes the following sections:
- Section 1: Online and Offline Social Supports
- Section 2: School Performance and Developmental Disorders
- Section 3: Aggression
- Section 4: Depressive Symptoms
- Section 5: Substance Use
- Section 6: Sexual Behavior
SECTION 1: ONLINE AND OFFLINE SOCIAL SUPPORTS
Caregiver-Child Relationships:
Youth were asked questions specific to the relationship they had with their parent or caregiver who knew the most about them. Questions were adapted from those used in the Youth Internet Safety Survey.4 Internal validity for the six-item caregiver-child relationship scale was acceptable (Wave 1 Cronbach’s alpha = 0.70; Wave 2 Cronbach’s alpha = 0.72; Wave 3 Cronbach’s alpha = 0.76).Wave 1 scores ranged from 10-34, with a mean of 26.11 (SE = 0.10) and median of 26; Wave 2 scores ranged from 9-34, with a mean of 25.71 (SE = 0.14) and median of 26; and Wave 3 scores ranged from 10-34, with a mean of 25.58 (SE = 0.13) and median of 26.
Overall, the majority of youth reported a positive relationship (i.e., strong emotional bond, consistent parental monitoring, little coercive discipline) with the caregiver that knew them the most.
The vast majority of youth (95-98%) reported that they get along with the caregiver that knows them best at least fairly well.
| Caregiver-Child Relationships: Emotional Bond – Child respondent | Wave 1 (n = 1,581) |
Wave 2 (n = 1,195) |
Wave 3 (n = 1,150) |
| Cronbach’s alpha | 0.62 | 0.66 | 0.71 |
| You get along with this caregiver… | |||
| Very well | 73% | 68% | 65% |
| Fairly well | 25% | 28% | 30% |
| Somewhat badly | 2% | 3% | 3% |
| Very badly | <1% | <1% | 1% |
| You feel this caregiver trusts you… | |||
| All of the time | 37% | 33% | 34% |
| Most of the time | 40% | 43% | 42% |
| Sometimes | 18% | 17% | 16% |
| Rarely | 3% | 5% | 6% |
| Never | 2% | 2% | 2% |
| If you were in trouble or sad you would discuss it with this caregiver… | |||
| All of the time | 28% | 30% | 28% |
| Most of the time | 36% | 32% | 32% |
| Sometimes | 22% | 25% | 25% |
| Rarely | 11% | 9% | 10% |
| Never | 4% | 4% | 4% |
Seventy-five percent of youth reported that they felt the caregiver that knows the most about them trusts them most of the time or all of the time and less than 8% of youth felt that this caregiver rarely or never trusts them. In comparison, youth less commonly reported that they would discuss if they were in trouble or sad with this caregiver. Despite getting older and more independent, scores indicated the level of emotional bond was relatively constant in the cohort over time.
The three-item emotional bond subscale demonstrated acceptable internal validity (Wave 1 Cronbach’s alpha = 0.62; Wave 2 Cronbach’s alpha = 0.66; Wave 3 Cronbach’s alpha = 0.71). Wave 1 scores ranged from 3-14, with a mean of 11.45 (SE = 0.07) and median of 12, Wave 2 scores ranged from 4-14, with a mean of 11.38 (SE = 0.09) and median of 12, and Wave 3 scores ranged from 3-14, with a mean of 11.19 (SE = 0.10) and median of 12.
Additionally, caregivers typically knew where youth were and who they were with when they were not at home.
| Caregiver-Child Relationships: Monitoring – Child respondent | Wave 1 (n = 1,581) |
Wave 2 (n = 1,195) |
Wave 3 (n = 1,150) |
| Cronbach’s alpha | 0.81 | 0.83 | 0.82 |
| This caregiver knows where you are when you are not home | |||
| All of the time | 68% | 59% | 57% |
| Most of the time | 25% | 31% | 33% |
| Sometimes | 5% | 7% | 8% |
| Rarely | 1% | 2% | 2% |
| Never | 1% | 2% | <1% |
| This caregiver knows who you are with when are not at home | |||
| All of the time | 66% | 57% | 51% |
| Most of the time | 25% | 31% | 37% |
| Sometimes | 7% | 8% | 10% |
| Rarely | 1% | 2% | 2% |
| Never | 1% | 3% | <1% |
Consistent caregiver monitoring of youth activities outside of the home (e.g., where they are, who they are with) was nearly universally endorsed by all youth. Furthermore, the rates between the two monitoring behaviors are strikingly similar. As would be expected as youth get older, a shift was noted from caregivers knowing where youth were and who they were all of the time to most of the time over the 36-month observation period.
The two-item parental monitoring subscale demonstrated acceptable internal validity (Wave 1 correlation = 0.81; Wave 2 correlation = 0.83; Wave 3 correlation = 0.82). Wave 1-Wave 3 scores ranged from 2-10. The mean for Wave 1 was 9.13 (SE = 0.05) with a median of 10, Wave 2 mean was 8.81 (SE = 0.07) with a median of 9, and Wave 3 mean was 8.81 (SE = 0.06) and median of 9.
32%-43% of youth reported that their caregiver never or rarely used coercive discipline (e.g., yelled at them, took away privileges).
| Caregiver-Child Relationships: Coercive Discipline – Child respondent | Wave 1 (n = 1,581) |
Wave 2 (n = 1,195) |
Wave 3 (n = 1,150) |
|
| Cronbach’s alpha | 0.53 | 0.55 | 0.60 | |
| This person yells at you | ||||
| All of the time | 3% | 4% | 5% | |
| Most of the time | 6% | 7% | 6% | |
| Sometimes | 53% | 47% | 49% | |
| Rarely | 32% | 36% | 35% | |
| Never | 6% | 7% | 6% | |
| This person takes away your privileges | ||||
| All of the time | 5% | 6% | 6% | |
| Most of the time | 8% | 9% | 8% | |
| Sometimes | 56% | 53% | 52% | |
| Rarely | 25% | 26% | 28% | |
| Never | 7% | 6% | 6% | |
The majority of youth said that the caregiver that knew them best sometimes yelled at them (47%-53%) or took away their privilege (52%-56%). Discipline is often a healthy aspect of the caregiver-child relationship so this may not be surprising. That said: excessive discipline can potentially be a cause for concern and be indicative of an unhealthy relationship. Among the cohort, 1 of every 20 youth reported that this caregiver disciplined them all of the time. Reasons for caregiver discipline were not queried; this information may have been helpful to provide additional insight into the appropriateness of loss of privileges or yelling experiences.
The two-item coercive discipline subscale had somewhat low internal validity (Wave 1 correlation = 0.53; Wave 2 correlation = 0.55; Wave 3 correlation = 0.60). Wave 1-Wave 3 scores ranged from 2-10. Wave 1 mean was 5.47 (SE = 0.05) with a median of 6, Wave 2 mean was 5.48 (SE = 0.06) with a median of 5, and Wave 3 mean was 5.47 (SE = 0.06) with a median of 5.
Online and Offline Social Supports:
Beginning at Wave 3, questions regarding youth’s access to social support with individuals that youth knew face to face (i.e., friends, people who were special in the youth’s life) were added to the survey. ‘Offline’ social support was measured using the Friend and Special Person subscales of the Multidimensional Scale of Perceived Social Support.5The eight-item scale demonstrated high internal validity (Cronbach’s alpha = 0.96); scores ranged from 8-56, with a mean of 42.72 (SE = 0.41) and median of 45.
More youth reported having offline social supports from a special person than a friend.
| Type of offline social support – Child respondent | Level of agreement Wave 3 (n=1,150) |
|||||||||
| Very strongly agree | Strongly agree | Mildly agree | Neutral | Mildly disagree | Strongly disagree | Very strongly disagree | ||||
| Offline social support from a special person(Cronbach’s alpha = 0.97) | ||||||||||
| There is a special person in your life who cares about your feelings | 27% | 35% | 15% | 13% | 3% | 1% | 5% | |||
| There is a special person with who you can share your joys and sorrows | 25% | 34% | 16% | 17% | 3% | 2% | 5% | |||
| You have a special person who is a real source of comfort to you | 25% | 35% | 15% | 15% | 3% | 2% | 5% | |||
| There is a special person who is around when you are in need | 24% | 33% | 17% | 16% | 4% | 2% | 4% | |||
| Offline social support from friends(Cronbach’s alpha = 0.94) | ||||||||||
| You have friends with whom you can share your joys and sorrows | 20% | 38% | 21% | 13% | 3% | 1% | 4% | |||
| You can talk about your problems with your friends | 17% | 35% | 22% | 15% | 3% | 3% | 5% | |||
| Your friends really try to help you | 16% | 36% | 24% | 16% | 2% | 3% | 3% | |||
| You can count on your friends when things go wrong | 16% | 36% | 22% | 16% | 3% | 3% | 4% | |||
As shown in the table on page 5, most youth had offline social support from either a special person or friend, whether it was someone who was around when the respondent was in need or someone who was there to share the respondent’s joys and sorrows. Across the different types of social support queried, 57%-70% of youth at least strongly agreed they had a special person and 52%-58% of youth at least strongly agreed they had a friend who did these things. On the other hand, one of every 20 youth very strongly disagreed that they received offline social supports from a friend or a special person.
Both subscales demonstrated strong internal validity (Friend subscale: Cronbach’s alpha = 0.97; Special Person subscale: Cronbach’s alpha = 0.94. The four-item offline social support friend subscale scores ranged from 4-28, with a mean of 21.11 (SE = 0.21) and median of 22. The four-item special person subscale scores ranged from 4-28, with a mean of 21.62 (SE = 0.23) and median of 24.
Given the impact of the Internet in the lives of youth today, questions were also added to get a sense of youth’s access to social support online. Youth who reported having friends online in the last year who they did not know in person were subsequently asked about the online relationship(s). These questions were based on the Friend and Special Person subscales of the Multidimensional Scale of Perceived Social Support 5 and modified to include the word ‘online’. The eight-item offline social support scale internal validity was acceptable (Cronbach’s alpha = 0.97); scores ranged from 8-56, with a mean of 30.30 (SE = 0.88) and median of 32.
Of the 21% of youth who reported a friendship with someone they only knew online, 1-5% of youth very strongly agreed they had online support from a friend or special person.
| Type of online social support– Child respondent | Level of agreement Wave 3(n=244) |
|||||||||
| Very strongly agree | Strongly agree | Mildly agree | Neutral | Mildly disagree | Strongly disagree | Very strongly disagree | ||||
| Online social support from a special person(Cronbach’s alpha = 0.96) | ||||||||||
| There is a special person online with who you can share your joys and sorrows | 5% | 10% | 16% | 33% | 11% | 11% | 15% | |||
| There is a special person online who is around when you am in need | 3% | 5% | 17% | 36% | 18% | 5% | 16% | |||
| You have a special person online who is a real source of comfort to me | 3% | 9% | 16% | 36% | 15% | 8% | 13% | |||
| There is a special person online in your life who cares about your feelings | 3% | 9% | 21% | 35% | 12% | 8% | 12% | |||
| Online social support from friends(Cronbach’s alpha = 0.95) | ||||||||||
| You have friends online with whom you can share your joys and sorrows | 2% | 12% | 20% | 31% | 14% | 7% | 14% | |||
| My friends online really try to help me | 1% | 10% | 27% | 35% | 10% | 6% | 11% | |||
| You can count on your friends online when things go wrong | 1% | 9% | 18% | 38% | 13% | 11% | 11% | |||
| You can talk about my problems with your friends online | 1% | 11% | 22% | 36% | 12% | 8% | 10% | |||
In comparison to offline social supports, among youth who reported a friendship with someone they met online and did not know in-person, fewer youth strongly agreed that they received support from this person (see Table above). In fact, most youth said that they were neutral about the support from online friends (31%-38%) or special people (33%-35%). The differences between level of agreement of support received from online and offline friends suggests that, even with the increase in popularity among social networks (e.g., Facebook) during this time, most youth continue to foster more socially supportive relationships face-to-face; or online with people that they also know in-person. The Internet can be a place to meet new people; but more often, it is a place to continue building upon offline relationships and support.
These subscales were found to be reliable (Friend subscale: Cronbach’s alpha = 0.95; Special Person subscale: Cronbach’s alpha = 0.96). The four-item online social support friend subscale scores ranged from 4-28, with a mean of 15.40 (SE = 0.44) and median of 16. The four-item special person subscale scores ranged from 4-28, with a mean of 14.91 (SE = 0.46) and median of 16.
SECTION 2: SCHOOL PERFORMANCE AND LEARNING DISABILITIES
School Performance:
Question regarding school characteristics and performance were asked of youth who reported attending a private or public school (i.e., not homeschooled; NWave1 = 1,579; NWave2 = 1,193; NWave3 = 1,144).
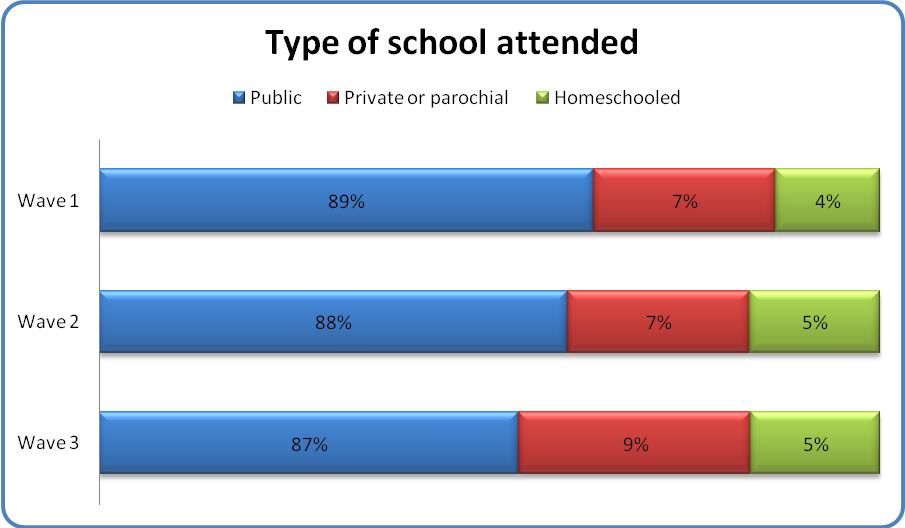
The majority of youth (87-89%) reported attending a public school. Less than 1 of every 10 youth reported attending a private or parochial school. About one in twenty youth were homeschooled. This diversity of education is a strength of the study, and reflects a difference between this methodology and school-based studies, which often exclude youth who are absent on the day of the survey as well as those who are homeschooled.
More than half of youth (57%) who were attending school reported getting mostly A’s or mostly A’s and B’s in school.
| Grades in school – Child respondent | Wave 1 (n = 1,579) |
Wave 2 (n = 1,193) |
Wave 3 (n = 1,144) |
| Mostly A’s | 16% | 18% | 15% |
| Mostly A’s and B’s | 41% | 39% | 42% |
| Mostly B’s | 12% | 9% | 11% |
| Mostly B’s and C’s | 21% | 21% | 20% |
| Mostly C’s | 4% | 5% | 6% |
| Mostly C’s and D’s | 4% | 5% | 4% |
| Mostly D’s | <1% | 1% | <1% |
| Mostly D’s and lower | 1% | 1% | 1% |
| My school does not use grades [1] | — | <1% | 1% |
[1] This response option was not available at Wave 1.
The majority of youth reported doing well in school (see Table on page 8). About 1 of every 3 youth reported getting mostly B’s or mostly B’s and C’s; and 2% reported getting mostly D’s or lower. One percent of youth reported that their schools did not use grades. The distribution of youth reported academic grades in school was consistent across time.
Commitment to school has been noted as a protective factor that buffers youth from engaging in violent or delinquent behavior, substance use, and other behaviors associated with negative outcomes.6 Starting at Wave 2, youth reported their like or dislike of school.
| Reported like or dislike of school – Child respondent | Wave 2 (n = 1,193) |
Wave 3 (n = 1,144) |
| Like a lot | 34% | 32% |
| Like a little | 27% | 30% |
| Neither like nor dislike | 15% | 18% |
| Dislike a little | 16% | 13% |
| Dislike a lot | 7% | 7% |
Two of every 3 youth who were in school reported they liked school (either a lot or a little). One in every 5 youth reported that they disliked school. A small percentage of youth reported they disliked school a lot (7% at both Wave 2 and Wave 3).
Lastly, school-attending youth were asked how many times they had been suspended or had detention in the last school year.
| Number of suspensions/ detentions in the last school year – Child respondent | Wave 1 (n = 1,516) |
Wave 2 (n = 1,137) |
Wave 3 (n = 1,092) |
| 0 times | 75% | 73% | 70% |
| 1 time | 11% | 11% | 13% |
| 2 times | 6% | 7% | 8% |
| 3 times | 2% | 4% | 4% |
| 4-9 times | 4% | 4% | 4% |
| 10-19 times | 1% | 1% | 1% |
| 20-29 times | <1% | <1% | <1% |
| 30 or more times | <1% | <1% | <1% |
Most youth (73%) were not suspended or given detention in school. Two in every 10 youth reported receiving this punishment between 1-3 times. Trends were stable across time.
Starting at Wave 2, parents also were asked how many times their child were suspended or received a detention in the last school year. As shown in the Table on page 10, responses were similar to those provided by youth. This suggests that in most cases, parents were aware of their children’s disciplinary experiences at school if they were occurring.
| Number of suspensions/ detentions child had in the last school year – Parent respondent | Wave 2 (n = 1,137) |
Wave 3 (n = 1,092) |
| 0 times | 77% | 75% |
| 1 time | 11% | 11% |
| 2 times | 7% | 8% |
| 3 times | 2% | 3% |
| 4-9 times | 3% | 2% |
| 10-19 times | <1% | <1% |
| 20-29 times | <1% | <1% |
| 30 or more times | <1% | <1% |
Developmental disorders:
Developmental disorders can interfere with one’s success at school, and also have been implicated in involvement with aggressive and violent behaviors.6 Starting at Wave 2, parents were asked whether their child was diagnosed with certain developmental disorders by a doctor or mental health professional.
More than 8 of every 10 parents (82-84%) reported that their child was not diagnosed with a developmental disorder.
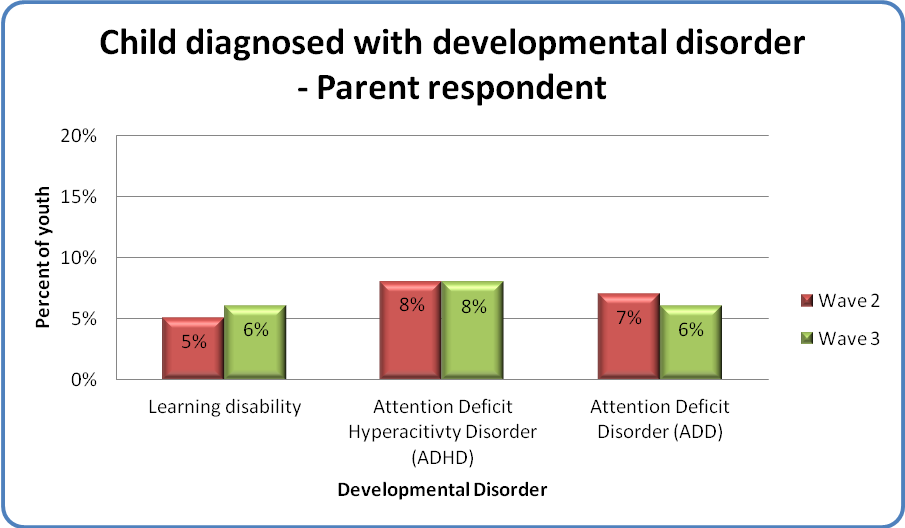
Rates of the three different developmental disorders were similar and remained stable over the 24-month period, suggesting that few youth were newly diagnosed between Wave 2 and Wave 3. This would be expected given the age of the cohort at that time (13-18 years).