
Text Messaging:
Text messaging was the fastest growing media exposure for youth over time.
| Text messaging in the past year- Child respondent | Wave 1(n = 1,581) | Wave 2(n = 1,195) | Wave 3(n = 1,150) |
| Number of days in a ‘typical week’ | |||
| 7 days | 12% | 25% | 40% |
| 5-6 days | 4% | 6% | 7% |
| 3-4 days | 6% | 7% | 6% |
| 1-2 days | 11% | 13% | 12% |
| 0 days | 66% | 50% | 35% |
| Amount of time in a ‘typical day’ | |||
| More than 3 hours | 2% | 7% | 12% |
| More than 2 hours –3 hours | 3% | 3% | 5% |
| More than 1 hour –2 hours | 4% | 6% | 9% |
| 31 minutes – 1 hour | 6% | 7% | 14% |
| 1 – 30 minutes | 19% | 26% | 24% |
| 0 minutes | 66% | 51% | 36% |
At Wave 1, the majority of youth reported not texting in a typical week; at Wave 3, the converse was true. Indeed, there was a three-fold increase in the percentage of youth who text messaged daily: from 12% at Wave 1 to 40% at Wave 3.
To provide directly comparable data with other mediums, youth were asked about the amount of time they spent texting. Similar to frequency, intensity of texting changed dramatically over time: at Wave 1, the most commonly endorsed time spent texting was ‘0 minutes’; this changed to ‘1-30 minutes’ at Wave 3. The number of text messages sent and received per day also increased across time:
- At Wave 2, the mean number of text messages sent per day was 32, with a range of 0-500 text messages.
- At Wave 3, the mean number of text messages sent per day was 50, with a range of 0-500 text messages.
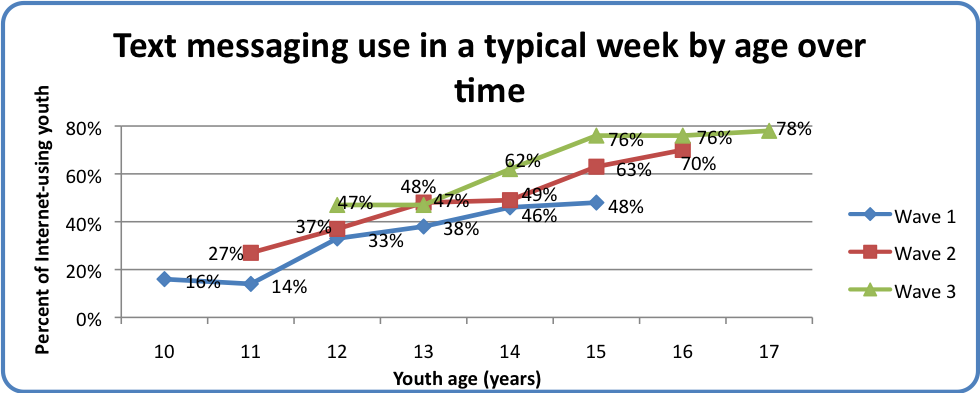
Observed increases in text message usage over time were due both to age and time trends. Among older teens, the prevalence of texting skyrocketed over time compared to younger teens: cell phone ownership and text messaging use more than doubled from 48% in Wave 1 to 76% in Wave 3 for 15-year-olds (see first Figure below).
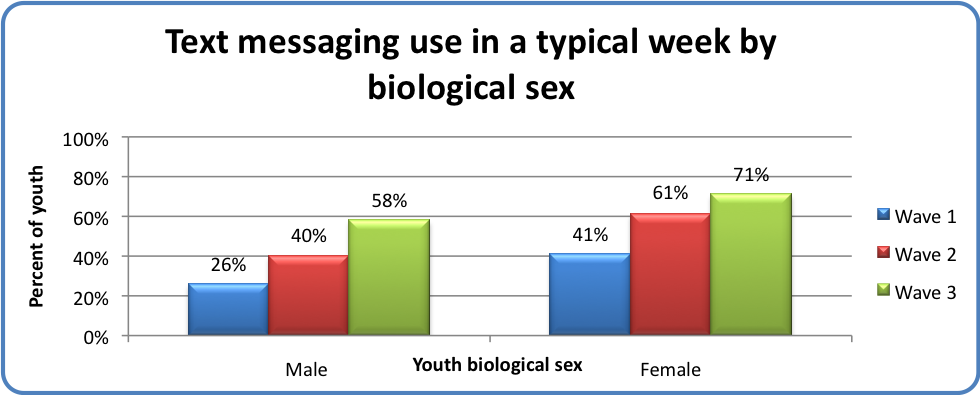
Girls were more likely than boys to report any text messaging across time. Weekly use of text messaging for both sexes steadily increased over the course of the study however, with 26% of males and 41% of females texting at Wave 1 compared to 58% and 71% at Wave 3, respectively.
Internet Use:
Over 95% of youth reported Internet use in a typical week.
| Internet use in the past year – Child respondent | Wave 1 (n=1,581) | Wave 2 (n=1,195) | Wave 3 (n=1,150) |
| Number of days in a ‘typical week’ | |||
| 7 days | 35% | 40% | 46% |
| 5-6 days | 16% | 21% | 19% |
| 3-4 days | 23% | 21% | 18% |
| 1-2 days | 24% | 16% | 16% |
| 0 days | 4% | 2% | 2% |
| Amount of time in a ‘typical day’ | |||
| More than 3 hours | 10% | 11% | 12% |
| More than 2 hours –3 hours | 10% | 13% | 11% |
| More than 1 hour –2 hours | 23% | 25% | 29% |
| 31 minutes – 1 hour | 28% | 29% | 26% |
| 1 – 30 minutes | 23% | 20% | 20% |
| 0 minutes | 5% | 2% | 3% |
As would be expected given that youth were required to use the Internet to be eligible to take part in the study, almost all youth reported using the Internet in a typical week. And, as time went on, more youth reported using the Internet daily. Nonetheless, intensity of Internet use was stable: only 11% of youth were usually online for more than three hours a day over time.
Interestingly, even among this Internet-using sample, young people were more likely to report intense television compared to Internet use.
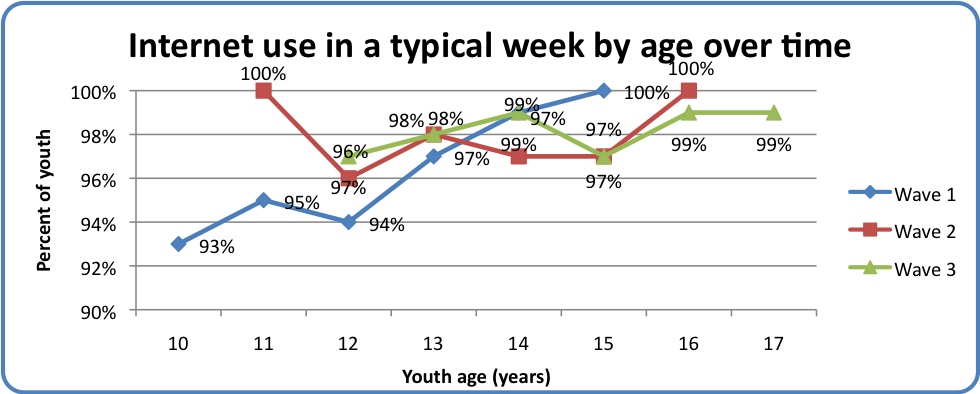
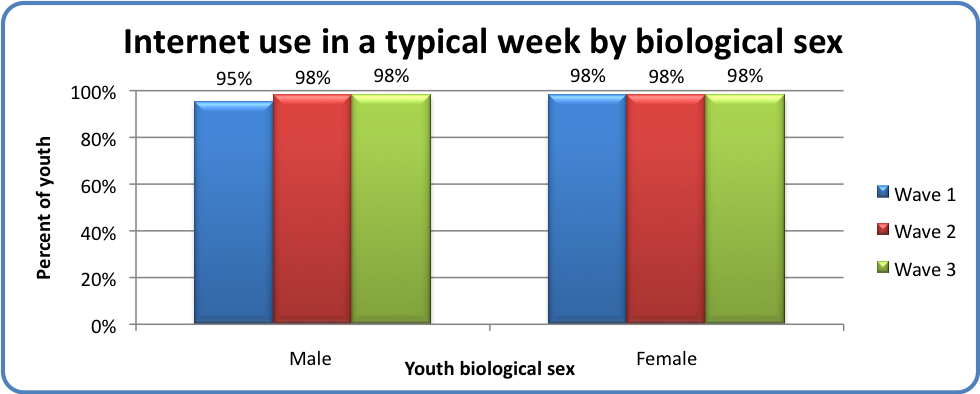
Similar to the pattern noted for music listeners, older and younger youth, and girls and boys were equally likely to report going on the Internet in a typical week.
Most youth accessed the Internet from a computer in a common room at home.
| Location most often used to access Internet in the past year – Child respondent | Wave 1 (n=1,581) | Wave 2 (n=1,195) | Wave 3 (n=1,150) |
| In a common room at home | 58% | 56% | 54% |
| In a private room at home | 18% | 18% | 18% |
| In my bedroom | 15% | 19% | 21% |
| At school | 5% | 4% | 3% |
| Somewhere else | 3% | 1% | 3% |
| At another person’s home | 1% | 2% | 1% |
| At the library | 1% | 1% | <1% |
It seems that Internet safety messaging is working: over half of youth usually used the Internet in a common room; about one-third usually went online in a private room. It is perhaps unsurprising that more than nine in ten youth (91-93%) went online most frequently at home (e.g., bedroom, common room).
Nonetheless, one in twenty youth usually went online from another location (e.g. school, library), serving as a caution against assumptions that home is the primary Internet access point for all youth.
Youth Activities on the Internet:
We also were interested in how youth use the Internet. Specifically, we wanted to know the two things youth spent most of their time doing when they were online.
Youth commonly spent most of their time online playing games (24-45%) and doing schoolwork (25-31%).
Even though playing games was the most common online activity at Wave 1, it halved in popularity over time. In contrast, social networking websites (such as MySpace and Facebook) doubled as one’s most common online activity over time.
| Most common Internet activities in the past year – Child respondent | Wave 1 (n=1,581) | Wave 2 (n=1,187) | Wave 3 (n=1,150) |
| Playing games | 45% | 32% | 24% |
| Doing schoolwork | 25% | 29% | 31% |
| Listening to music | 23% | 29% | 28% |
| Instant messaging | 22% | 22% | 19% |
| Surfing the web | 17% | 14% | 17% |
| Social networking websites | 17% | 32% | 38% |
| Emailing | 15% | 14% | 15% |
| Buying things or looking at prices | 6% | 5% | 6% |
| Something else | 6% | 5% | 4% |
| Going to chat rooms | 3% | 1% | 1% |
| Podcasting/downloading files or software | 2% | 2% | 3% |
| Readings news or current affairs | 2% | 2% | 2% |
| Blogging | 1% | 1% | 1% |
| Designing websites | 1% | 1% | 1% |
Notable differences in how boys and girls used the Internet emerged: girls were more likely to endorse social networking sites, emailing, instant messaging, and listening to music whereas boys were more likely to endorse playing games, surfing the web, and buying or looking at price on websites (e.g., Amazon, Ebay) as their most common online activities.
Consistently across time, older youth were more likely to report going to social networking sites and using instant messaging than younger youth. Younger youth were more likely than older youth to play games online.
Youth perception of Internet use abilities increased over time.
| Ability to use the Internet – Child respondent | Wave 1(n = 1,581) | Wave 2(n = 1,195) | Wave 3(n = 1,150) |
| Excellent | 36% | 46% | 50% |
| Good | 48% | 44% | 44% |
| Fair | 15% | 10% | 6% |
| Poor | 2% | <1% | <1% |
Over time, there was a up-shift in self-ratings of Internet abilities. Most commonly, youth considered themselves to be good Internet users at Wave 1. By Wave 3, most youth commonly rated their Internet ability as excellent. Less than 2% of youth considered themselves poor Internet users across time.
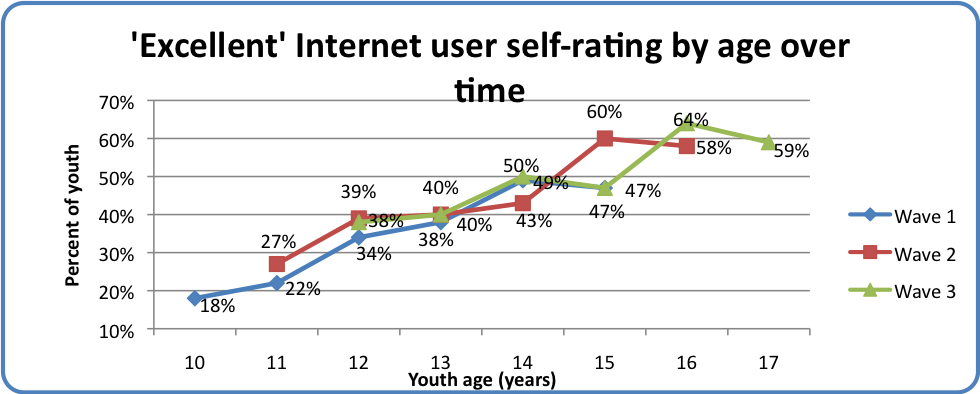
Shifts in self-ratings were largely explained by increased age of the cohort.
Parental Use of the Internet:
The majority of parents (84-89%) went online every day or almost every day.
Most parents went online daily for between 31 minutes and 2 hours. Despite our assumptions that youth are more intensive Internet users than adults, slightly more parents (25-28%) than youth (20-23%) reported being online for more than 2 hours per day. This may be because many adults are online as part of their work. Again, findings encourage us to consistently challenge our assumptions with the use of research data before making conclusions.
| Internet use in the past year – Parent respondent | Wave 1(n = 1,577) | Wave 2(n = 1,189) | Wave 3(n = 1,149) |
| Every day/ almost every day | 89% | 85% | 84% |
| A few times a week | 10% | 13% | 12% |
| Once a week | 1% | 1% | 3% |
| Once every few weeks | <1% | <1% | <1% |
| Once a month | <1% | <1% | <1% |
| Once every few months | 0% | <1% | 0% |
| Less often than once every few months | <1% | <1% | <1% |
| Amount of time in a ‘typical day’ | |||
| More than 3 hours | 16% | 15% | 17% |
| More than 2 hours –3 hours | 11% | 10% | 11% |
| More than 1 hour –2 hours | 34% | 33% | 34% |
| 31 minutes – 1 hour | 27% | 29% | 24% |
| 1 – 30 minutes | 12% | 13% | 14% |
| 0 minutes | <1% | 1% | 1% |