Video, Computer, and Internet Game Play:
Internet games were asked separately from video and computer games to examine potential differences across medium.
About 3 of every 4 youth reported playing Internet games in a typical week.
| Internet games played in the past year- Child respondent | Wave 1(n = 1,581) | Wave 2(n = 1,195) | Wave 3(n = 1,150) |
| Number of days in a ‘typical week’ | |||
| 7 days | 11% | 12% | 13% |
| 5-6 days | 8% | 9% | 7% |
| 3-4 days | 21% | 17% | 15% |
| 1-2 days | 36% | 35% | 37% |
| 0 days | 24% | 27% | 27% |
| Amount of time in a ‘typical day’ | |||
| More than 3 hours | 4% | 4% | 5% |
| More than 2 hours –3 hours | 4% | 4% | 4% |
| More than 1 hour –2 hours | 12% | 11% | 12% |
| 31 minutes – 1 hour | 23% | 22% | 19% |
| 1 – 30 minutes | 32% | 31% | 31% |
| 0 minutes | 25% | 28% | 29% |
Most youth played Internet games in a typical week, and did so for an hour or less in a typical day when they played.
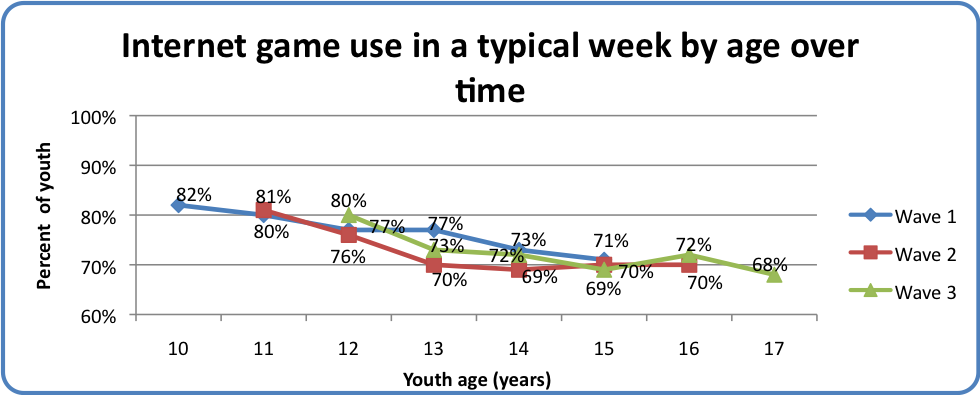
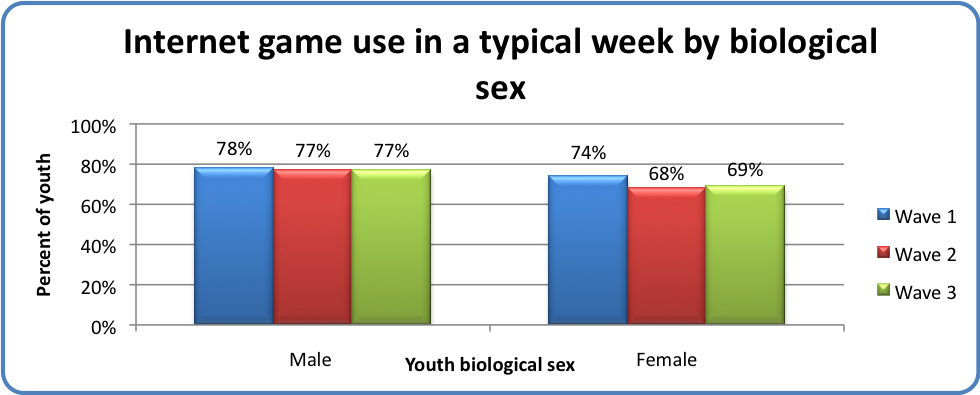
Consistently across time, Internet game play was more common among younger youth than older youth. Boys and girls were equally likely however, to report use of Internet games.
The majority of youth (84-90%) reported playing video or computer games in a typical day
Similar to Internet games, most youth reported playing computer and video games at least once in a typical week. More youth reported daily computer and video game use compared to online game use however. Game play also was slightly more intense, with twice as many youth playing these types of games for more than 1 hour-2 hours daily compared to Internet games.
| Computer and video games played in the past year – Child respondent | Wave 1 (n=1,581) |
Wave 2 (n=1,195) | Wave 3 (n=1,150) |
| Number of days in a ‘typical week’ | |||
| 7 days | 22% | 19% | 19% |
| 5-6 days | 17% | 15% | 12% |
| 3-4 days | 23% | 23% | 20% |
| 1-2 days | 27% | 30% | 33% |
| 0 days | 10% | 14% | 16% |
| Amount of time in a ‘typical day’ | |||
| More than 3 hours | 9% | 7% | 7% |
| More than 2 hours –3 hours | 9% | 9% | 7% |
| More than 1 hour –2 hours | 22% | 19% | 21% |
| 31 minutes – 1 hour | 25% | 25% | 23% |
| 1 – 30 minutes | 22% | 25% | 24% |
| 0 minutes | 12% | 16% | 18% |
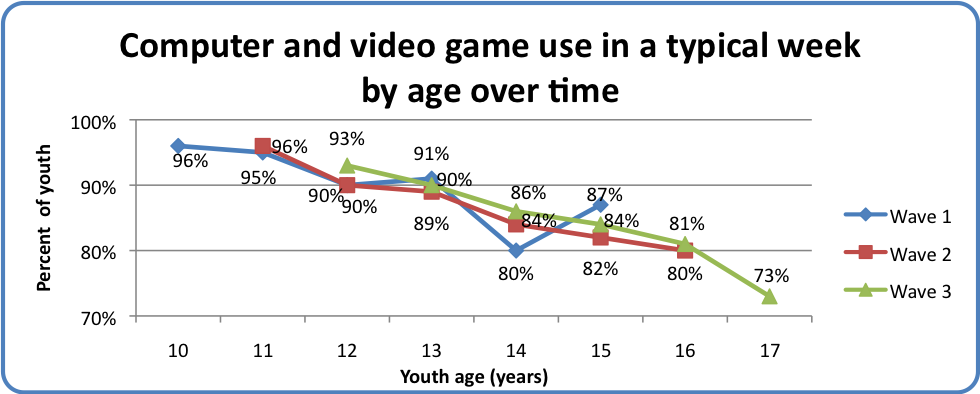
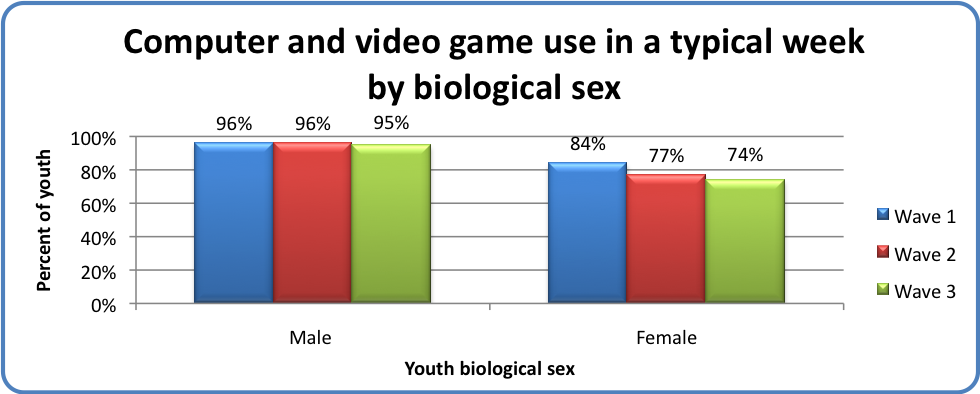
Use of computer and video games by age was elevated compared to Internet games, but similar age trends were noted: as youth got older they were less likely to play games in a typical week. Across all waves of data collection, boys were more likely to play computer or video games than girls. Moreover, rates of game play were stable for boys but decreased over time for girls.
Game players most commonly played games in a common room.
| Video games | Computer / Internet games | ||||
| Location most often used to play video games – Child respondent | Wave 1 (n=1,481) | Wave 2 (n=1,109) | Wave 3 (n=1,041) | Wave 2 (n=1,124) | Wave 3 (n=1,059) |
| In a common room at home | 52% | 39% | 49% | 41% | 51% |
| In my bedroom | 31% | 27% | 32% | 13% | 19% |
| In a private room at home | 12% | 6% | 8% | 13% | 14% |
| At another person’s home | 2% | 4% | 6% | 4% | 4% |
| Somewhere else | 2% | 16% | 2% | 16% | 2% |
| At school | 1% | 1% | <1% | 3% | 1% |
| At the library | <1% | <1% | <1% | 2% | 1% |
| I do not play [computer/ Internet]
games |
— | 6% | 4% | 9% | 8% |
Youth played games in a variety of locations, yet similar to youth Internet use, most youth (67-95%) played somewhere in their home – and this most frequently was a common room.
Game Ratings:
In general, across time, the cohort reported playing games that were age-appropriate.
About 1 of every 4 youth played video games rated ‘Mature’.
| Ratings of games played – Child respondent | Wave 1(n = 1,481) | Wave 2(n = 1,124) | Wave 3(n = 1,059) |
| T (Teen) | 64% | 61% | 69% |
| E (Everyone) | 61% | 58% | 53% |
| M (Mature) | 19% | 24% | 28% |
| EC (Early Childhood) | 3% | 2% | 1% |
| AO (Adults Only) | 1% | 1% | 2% |
| RP (Rating Pending) | 1% | 1% | 1% |
| Not sure | — | 8% | 9% |
Across time, most youth played “T” (Teen) rated games, which are intended for audiences 13 years and older. About 1 of every 5 youth at Wave 1 reported playing “M” (Mature) rated games, which are intended for audiences 17 years. Given that our oldest respondents were 15 years old, this suggests that some youth were playing games intended for older audiences. As would be expected with an aging cohort, gamers were less likely to play “E” and more likely to play “M” rated games over time.