
Growing Up With Media:
Exposure to Violence and Sex in Media
January 2012
Researchers, public policy officials, and the general public as a whole have long been concerned about the consequences of youths’ exposure to violence and sex in the media. Recent studies have documented the explosion of different types of media available to youth 1, 2 and the widespread presence of violence in these media outlets.3
This is the third in a series of 6 bulletins summarizing the methodology for and findings of the Growing up with Media (GuwM) Study. GuwM is a longitudinal survey of 1,586 youth aged 10-15 years at baseline. Data were collected initially between August – September, 2006, again between November, 2007 – January, 2008, and finally between August – November, 2008. The survey protocol was reviewed and approved by the Centers for Disease Control and Prevention Institutional Review Board (IRB).
What is Growing up with Media?
- GuwM is a longitudinal online survey of a national sample of 1,586 young people, ages 10 to 15 years at Wave 1.*
- Because exposures and experiences online were a main interest of the survey, youth were required to have used the Internet at least once in the past 6 months. The inclusion criteria was purposefully broad to ensure a wide variability in internet experience and exposure.
- Caregivers were members of the Harris Poll Online (HPOL) opt-in panel and residents of the U.S.
- Caregivers first completed a short online survey (approximately 5 minutes).
- With caregiver permission, youth completed an online survey; approximately 25 minutes.
- The sample was purposefully balanced on youth age and sex.
- Adult participants received $10 and youth a $15 gift certificate at Waves 1 and 2. To increase the response rate at Wave 3, adult participants received $20 and youth a $25 gift certificate.
- Data were collected across three time points:
- Wave 1: August – September, 2006
- Wave 2: November, 2007 – January, 2008
- Wave 3: August – November, 2008
- Data were weighted to match the U.S. Population of adults with children between the ages of 10 and 15 years. Adults were the weighting target because they were the recruitment target.
- Propensity scoring was applied to adjust for the adult’s (i.e., recruitment target) propensity to be online, in HPOL, and to respond to the particular survey invitation.
- A full report on the methodology of the GuwM study is posted here.
*As a result of data cleaning activities, the final sample size for Wave 1 is 1,581 (See the Methodological Details bulletin for more details).
The emergence of new and easily accessible media (e.g., video and computer games, Internet websites, television) has potentially increased opportunities for children and youth to be exposed to violence. Previous research has shown linkages between violence on TV 4-6 and video games,7, 8 suggesting that media violence is one of many important factors contributing to violent and aggressive behavior among youth. However, the extent to which this earlier research is relevant for understanding the potential harmful effects of newer, more realistic and graphic games is unclear.9
With the increase in new media, it is important to first gain a current understanding of how many youth are exposed to violent and sexual content and where this content exposure is occurring (e.g., video games, television, Internet websites) before further investigation into the consequences of such exposure.
In this report, we examine the frequency of exposure to violence and sex in media content. We also examine trends across time (i.e., Wave). The report includes the following sections:
- Section 1: A comparison of exposure to violent content by medium
- Section 2: A detailed examination of exposure to violent content on the Internet
- Section 3: A comparison of exposure to X-rated and other sexual content by medium
SECTION 1: A COMPARISON OF EXPOSURE TO VIOLENT CONTENT BY MEDIUM
Youth were asked, in the last 12 months, how many [media type; e.g., TV or movies] showed violence, such as physical fighting, hurting, shooting, or killing. Four mediums were queried:
- TV or movies
- Music
- Video, computer, or Internet games
- Websites (either with real people or cartoons)+

+Focus groups were conducted to inform the survey design. In these focus groups, boys talked about cartoon websites, such as stickdeath.com, which seemed to be different from sites showing real people engaging in violence (e.g., death sites showing real people dead or dying). As such, the survey queried two different types of online exposures: those of real people, and those of cartoons.
Youth reported exposure to violence across all media types but most commonly on TV and in movies.
| Exposure to violent media in past 12 months by medium | Wave 1 (n=1,581) |
Wave 2 (n=1,195) |
Wave 3 (n=1,150) |
| TV or movies showing violence | |||
| Almost all/ all of them | 8% | 6% | 9% |
| Many of them | 23% | 25% | 25% |
| Some of them | 53% | 51% | 50% |
| Almost none/ none of them | 16% | 17% | 16% |
| Music songs talking about violence | |||
| Almost all/ all of them | 4% | 2% | 3% |
| Many of them | 11% | 9% | 9% |
| Some of them | 42% | 43% | 43% |
| Almost none/ none of them | 43% | 46% | 45% |
| Video, computer or Internet games showing violence | |||
| Almost all/ all of them | 8% | 9% | 10% |
| Many of them | 16% | 15% | 19% |
| Some of them | 38% | 35% | 32% |
| Almost none/ none of them | 30% | 34% | 32% |
| Did not play video, computer or Internet games in past 12 months | 7% | 7% | 7% |
| Websites showing violence- real people | |||
| Almost all/ all of them | <1% | 1% | 1% |
| Many of them | 2% | 2% | 3% |
| Some of them | 11% | 12% | 15% |
| Almost none/ none of them | 86% | 85% | 81% |
| Websites showing violence- cartoons | |||
| Almost all/ all of them | 2% | 1% | 1% |
| Many of them | 7% | 6% | 4% |
| Some of them | 33% | 29% | 23% |
| Almost none/ none of them | 58% | 65% | 71% |
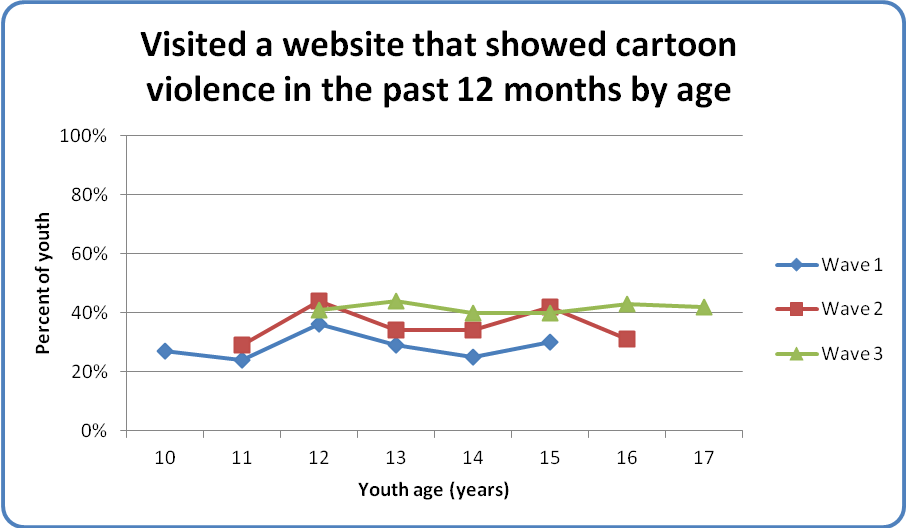
Between 31-34% of youth said that many, almost all, or all of the television and movies that they watched depicted physical fighting, shooting, or killing. Similar rates were reported for video, computer, and Internet games (24-29%). In contrast, 11-15% of youth said that many, almost all, or all of the music they listened to depicted violence, and only 2-9% of youth said that many, almost all, or all of the websites they visited showed violence involving either real people or cartoons.Rates of non-exposure followed similar trends across mediums: more than 3 of every 5 youth said that almost none or none of the websites they viewed in the last 12 months showed cartoon violence; 4 of every 5 youth said that almost none or none of the websites they viewed showed violence with real people; 2 of every 5 youth said that almost none or none of the music; and 1 of every 3 youth said that almost none or none of the games they played showed violence. Conversely, few youth (16-17%) said that almost none or none of the television they watched showed violence.Rates of exposure to violence were stable over time for all types of media except websites showing cartoon violence, which decreased from 42% at Wave 1 to 28% at Wave 3. This difference was not explained by the increased age of the cohort (see Figure below).
Although exposure to violence may be common, it does seem possible to allow children to use varied medium types while also limiting their exposure to violence. This seems to be particularly true for online use, but also is likely attainable for other mediums that have high rates of violence exposure as demonstrated by the 16-17% of youth reporting no violence exposure even when watching television.Boys (84%-87%) were nearly twice as likely as girls (42%-47%) to report being exposed to at least some violence in the video, computer, and Internet games played. Sex differences were noted, although comparatively attenuated, for exposure to violence in television and online as well. Interestingly, about half of boys as well as girls reported listening to at least some violent songs.
| Any (i.e., at least ‘some’) exposure to physical fighting, shooting, killing in past 12 months | Medium | ||||
| TV shows or movies | Video, computer, & Internet games ** | Websites showing real people | Websites showing cartoons | Music / songs | |
| Wave 1 | |||||
| Male (n=794) | 90% | 87% | 16% | 49% | 59% |
| Female (n=787) | 78% | 47% | 11% | 35% | 55% |
| Wave 2 | |||||
| Male (n=604) | 90% | 84% | 20% | 42% | 56% |
| Female (n=591) | 76% | 42% | 9% | 29% | 52% |
| Wave 3 | |||||
| Male (n=582) | 91% | 85% | 24% | 37% | 57% |
| Female (n=568) | 77% | 44% | 14% | 20% | 53% |
**This question was only asked of youth who reported playing video, computer, or Internet games in the past 12 months (NWave1=1,481 [boy=773; girl=708]; NWave2 = 1,124 [boy=594; girl=530]; NWave3 = 1,059 [boy=568; girl=491].
Video, Computer, or Internet Games:
Youth who more strongly relate to the characters in video games are more likely to be affected by the violent content.10, 11 Youth who, in the past 12 months, played at least some video, computer or Internet games that showed violence (NWave1 = 969; NWave2 = 700; NWave3 = 691) were asked how much they thought that the games were like real life and how much the characters were like them or people they know.
| Video, computer, and Internet games played showing physical fighting, shooting, killing in past 12 months are ‘like real life’ | Wave 2 (n = 969) |
Wave 2 (n = 700) |
Wave 3 (n = 691) |
| Almost exactly like real life | 7% | 5% | 4% |
| Somewhat like real life | 40% | 34% | 38% |
| Nothing like real life | 53% | 61% | 58% |
About 2 of every 5 youth who played video, computer, or Internet games showing physical fighting, shooting, or killing in the past 12 months said that the games were somewhat or almost exactly like real life (see Table above).
| Video, computer, and Internet games played showing physical fighting, shooting, killing in past 12 months are ‘like me or people I know’ | Wave 1 (n = 969) |
Wave 2 (n = 700) |
Wave 3 (n = 691) |
|
| Just like me or people I know | 2% | 2% | 2% | |
| Kind of like me or people I know | 17% | 13% | 17% | |
| Nothing like me or people I know | 81% | 85% | 81% | |
However, only about 1 of every 5 of these youth said that the game characters were kind of or just like them or people they knew. It may be that the situations, not the characters, more fully resonate with youth who play violent games.
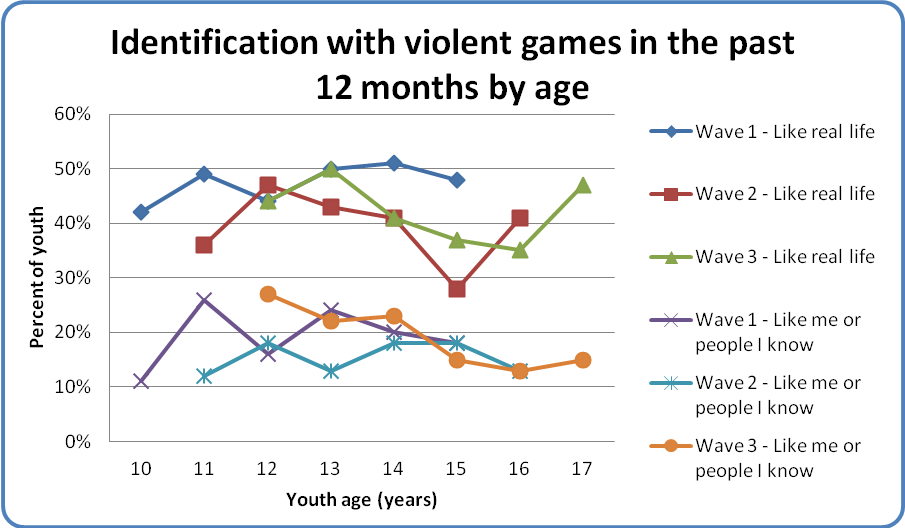 As youth grow older, one would think they would be better able to distinguish between real life and what they see and hear in media. Our data suggest that of youth who at least sometimes watched violence in the games they played, older youth were not less likely to report that the situations in the games they played were at least somewhat like real life. On the other hand, as young people got older, generally they were less likely to report that the characters in the games they played were at least somewhat like them or people they knew.