SECTION 3: AGGRESSION
Anger can be either a state that changes over time (e.g., I feel angry right now), or a trait that is relatively stable over time (e.g., I am generally an angry person). As a measure of trait aggressiveness, the tendency to respond to stimuli was measured by the ten-item State-Trait Anger Expression Inventory (STAXI-CA) T-Anger subscale 7 (Wave 1 Cronbach’s alpha = 0.85; Wave 2 Cronbach’s alpha = 0.88; Wave 3 Cronbach’s alpha = 0.87). Wave 1-Wave 3 scores ranged from 10-30. The mean for Wave 1 was 18.63 (SE = 0.16) with a median of 19, Wave 2 mean was 18.77 (SE = 0.19) with a median of 19, and Wave 3 mean was 18.81 (SE = 0.19) and median of 19.
One of every 7 (14%-17%) youth said they get angry quickly.
| STAXI Traits – Child respondent | Wave 1 (n = 1,581) |
Wave 2 (n = 1,195) |
Wave 3 (n = 1,150) |
||
| I am hotheaded | Hardly ever true | 59% | 58% | 57% | |
| Sometimes true | 32% | 32% | 32% | ||
| Often true | 9% | 10% | 10% | ||
| I feel angry | Hardly ever true | 54% | 52% | 50% | |
| Sometimes true | 39% | 41% | 43% | ||
| Often true | 7% | 7% | 7% | ||
| I get angry quickly | Hardly ever true | 50% | 52% | 55% | |
| Sometimes true | 36% | 34% | 29% | ||
| Often true | 14% | 14% | 17% | ||
| I feel like yelling when I do something good and someone says I did bad | Hardly ever true | 38% | 35% | 36% | |
| Sometimes true | 38% | 42% | 40% | ||
| Often true | 24% | 23% | 24% | ||
| I feel annoyed when I do a good job and no one notices me | Hardly ever true | 34% | 31% | 29% | |
| Sometimes true | 47% | 48% | 50% | ||
| Often true | 19% | 21% | 21% | ||
| I feel grouchy | Hardly ever true | 33% | 33% | 31% | |
| Sometimes true | 61% | 60% | 62% | ||
| Often true | 6% | 6% | 7% | ||
| I get angry when I do well and I am told I did something wrong | Hardly ever true | 30% | 26% | 26% | |
| Sometimes true | 41% | 42% | 45% | ||
| Often true | 28% | 31% | 30% | ||
| I feel mad | Hardly ever true | 17% | 20% | 22% | |
| Sometimes true | 70% | 66% | 64% | ||
| Often true | 13% | 14% | 14% | ||
| I get mad when I am punished unfairly | Hardly ever true | 17% | 17% | 16% | |
| Sometimes true | 44% | 43% | 45% | ||
| Often true | 39% | 41% | 39% | ||
| I feel angry when I am blamed for something I didn’t do | Hardly ever true | 13% | 15% | 12% | |
| Sometimes true | 39% | 36% | 41% | ||
| Often true | 49% | 49% | 47% | ||
Youth’s propensity to respond to a situation with anger was most commonly endorsed when they felt they were being blamed for something they didn’t do or felt like they were being punished unfairly (see Table on page 12). Youth were least likely to characterize themselves as hotheaded, to feel angry, or to get angry quickly. Consistent with the hypothesis that this scale measures a trait (i.e., something inherent and stable), rates of anger appear to be relatively constant over time.
SECTION 4: DEPRESSIVE SYMPTOMS
At Wave 3, a modified version of the Center for Epidemiologic Studies Depression (CESD) Scale-Revised was added to the survey instrument.8 Ten items were included to measure the 10 DSM-IV symptoms of major depression for children and adolescents.9 Internal consistency was high (Wave 3 Cronbach’s alpha = 0.90). Scores ranged from 10-50 with a mean of 14.99 (SE = 0.24) and a median of 13.
8%-44% of youth reported experiencing symptoms of depression in the past week.
| Depressive symptom – Child respondent | Frequency of symptomsWave 3 (n=1,150) | ||||
| Not at all or less than 1 day in the last week | 1-2 days in the last week | 3-4 days in the last week | 5-7 days in the last week | Nearly every day for 2 weeks | |
| I wished I were dead | 92% | 4% | 2% | 1% | 2% |
| I felt like a bad person | 84% | 11% | 2% | 1% | 2% |
| I lost interest in my usual activities | 83% | 11% | 4% | 1% | 2% |
| I felt I was moving too slowly | 75% | 16% | 6% | 2% | 2% |
| My appetite was poor | 75% | 15% | 5% | 2% | 3% |
| I could not focus on the important things | 62% | 23% | 8% | 4% | 4% |
| I felt irritable | 59% | 26% | 8% | 3% | 4% |
| My sleep was restless | 58% | 25% | 9% | 4% | 4% |
| I felt sad | 58% | 29% | 7% | 3% | 3% |
| I was tired all the time | 56% | 24% | 11% | 3% | 6% |
The majority of youth did not have any depressive symptoms in the past week or so. However, persistent symptoms of depression that lasted nearly every day for 2 weeks were reported by 2%-6% of youth. When looking at specific symptoms, being tired all the time was the most commonly endorsed symptom (44%) reported by youth, closely followed by 42% who reported they felt sad. Suicidal ideation was the least common symptom experienced in the week (8%).
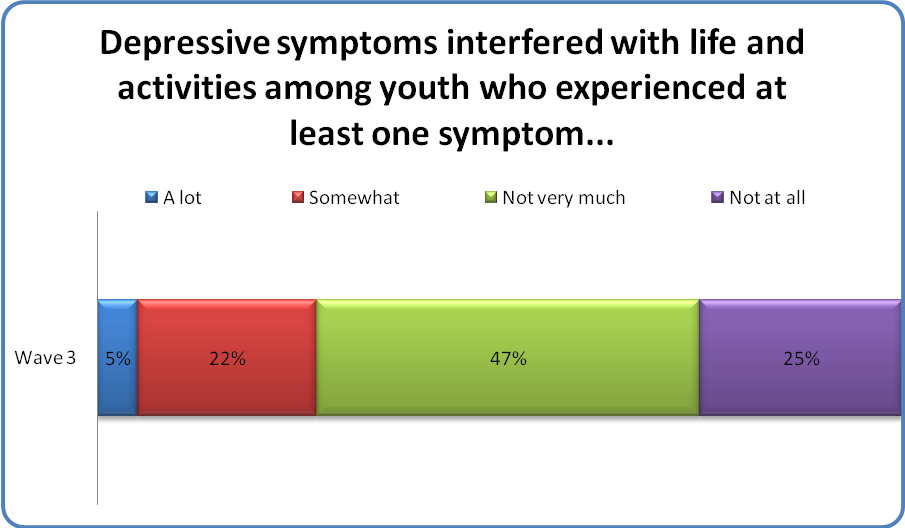
According to the DSM-IV, something must interfere with one’s life for it to be a disorder. Among youth who reported any depressive symptoms(NWave3 = 860), most (47%) reported being not very much affected by the depressive symptom(s), with an additional 25% reporting being not at all affected. Nonetheless, one of every 20 youth who said that they experienced at least one depressive symptom in the past week or so said that their symptoms or behaviors interfered a lot with their life or activities.
Sixty-three percent of youth who reported symptoms of depression in the past week reported between 1 to 4 depressive symptoms.
| Number of depressive symptoms experienced in the past week or so among those who reported at least one depressive symptom – Child respondent | Wave 3 (n = 860) |
| 1 symptom | 16% |
| 2 symptoms | 17% |
| 3 symptoms | 15% |
| 4 symptoms | 15% |
| 5 symptoms | 11% |
| 6 symptoms | 9% |
| 7 symptoms | 5% |
| 8 symptoms | 6% |
| 9 symptoms | 4% |
| 10 symptoms | 2% |
As shown in the previous table, most youth (63%) who reported symptoms of depression reported 4 or fewer symptoms. Nonetheless, more than 1 of every 3 youth reported five or more symptoms of depression in the past week.
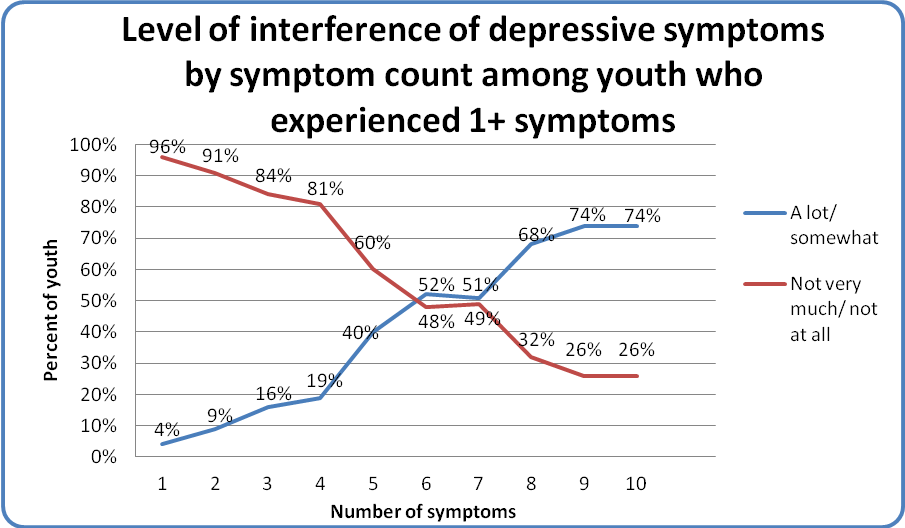
Among youth who experienced at least one depressive symptom in the past week or so (NWave3 = 860), the interference of youth’s depressive symptoms with their life and activities appears to be explained by the number of symptoms youth had. Trend lines suggest a direct relationship between symptom count and the level of interference these symptoms had in the youth’s life: as the number of symptoms increased, so too did the percent of youth who reported being a lot or somewhat affected. For example, 74% of youth experiencing 10 symptoms said that the symptoms affected them at least somewhat compared to 4% who had 1 symptom.
Of the youth who experienced one or more depressive symptoms, 93% did not meet DSM-IV criteria for depressive disorder.
| DSM-IV diagnosis among youth who reported at least one depressive symptom every day for the past 2 weeks – Child respondent | Wave 3 (n = 860) |
| Subclinical symptomatology (symptoms fewer than every day in the past 2 weeks) | 93% |
| Mild depressive disorder (at least two symptoms nearly every day in the past 2 weeks) | 5% |
| Major depressive disorder (5+ symptoms nearly every day in the past 2 weeks, one of which is sadness or loss of interest) | 2% |
Among youth who said they had experienced at least one depressive symptom in the past two weeks, 5% had at least two symptoms nearly every day for the past two weeks. Two percent of youth met the criteria for major depression (i.e., experiencing 5 or more symptoms nearly every day in the past 2 weeks, including sadness and/ or loss of interest).
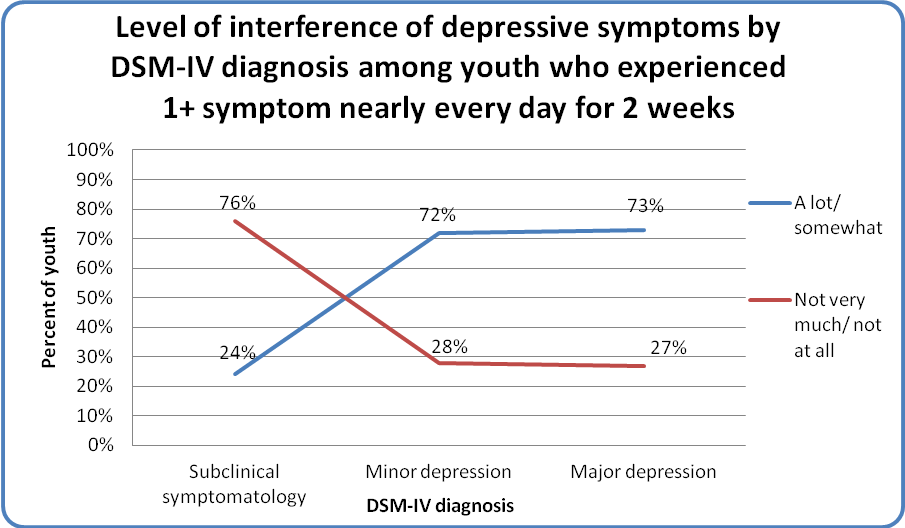
Seventy-three percent of youth who met the DSM-IV criteria for major depressive disorder (n=18) and 72% of youth who met criteria for minor depressive disorder (n=45) reported functional impairment (i.e., the symptoms interfered with their lives somewhat or a lot).


