Growing Up With Media:
Media Use Patterns
January 2012
Today’s youth are growing up in a media-rich environment. Use ranges from the more passive (watching television, listening to music) to the more interactive (video games, the Internet, and text messaging). The Growing up with Media Study confirms that today’s youth are using a wide range of media technologies, with usage patterns remaining fairly stable over the three year observation period, 2006-2008.
This is the fourth in a series of 6 bulletins summarizing the methodology for and findings from the Growing up with Media (GuwM) Study. GuwM is a longitudinal survey of 1,586 youth aged 10-15 years at baseline. Data were collected initially between August – September, 2006, again between November, 2007 – January, 2008, and finally between August – November, 2008. The survey protocol was reviewed and approved by the Centers for Disease Control and Prevention Institutional Review Board (IRB).
We asked youth about six specific types of media use:
- Playing computer games or video games
- Playing Internet games
- Watching television
- Listening to music
- Going on the Internet
- Text messaging
In this report, we examine media usage across a variety of mediums available to children and adolescents. We also examine trends across time (i.e., Wave). The report includes the following sections:
- Section 1: Overview of media use
- Section 2: Media use patterns by specific media type
- Section 3: Characteristics of Wii and MMOG game play
- Section 4: A comparison of exposure to X-rated and other sexual content by medium
What is Growing up with Media?
- GuwM is a longitudinal online survey of a national sample of 1,586 young people, ages 10 to 15 years at Wave 1.
- Because exposures and experiences online were a main interest of the survey, youth were required to have used the Internet at least once in the past 6 months. The inclusion criteria was purposefully broad to ensure a wide variability in internet experience and exposure.
- Caregivers were members of the Harris Poll Online (HPOL) opt-in panel and residents of the U.S.
- Caregivers first completed a short online survey (approximately 5 minutes).
- With caregiver permission, youth completed an online survey; approximately 25 minutes.
- The sample was purposefully balanced on youth age and sex.
- Adult participants received $10 and youth a $15 gift certificate at Waves 1 and 2. To increase the response rate at Wave 3, adult participants received $20 and youth a $25 gift certificate.
- Data were collected across three time points:
- o Wave 1: August – September, 2006
- o Wave 2: November, 2007 – January, 2008
- o Wave 3: August – November, 2008
- Data were weighted to match the U.S. Population of adults with children between the ages of 10 and 15 years. Adults were the weighting target because they were the recruitment target.
- Propensity scoring was applied to adjust for the adult’s (i.e., recruitment target) propensity to be online, in HPOL, and to respond to the particular survey invitation.
As a result of data cleaning activities, the final sample size for Wave 1 is 1,581 (See the Methodological Details bulletin for more details).
SECTION 1: OVERVIEW OF MEDIA USE
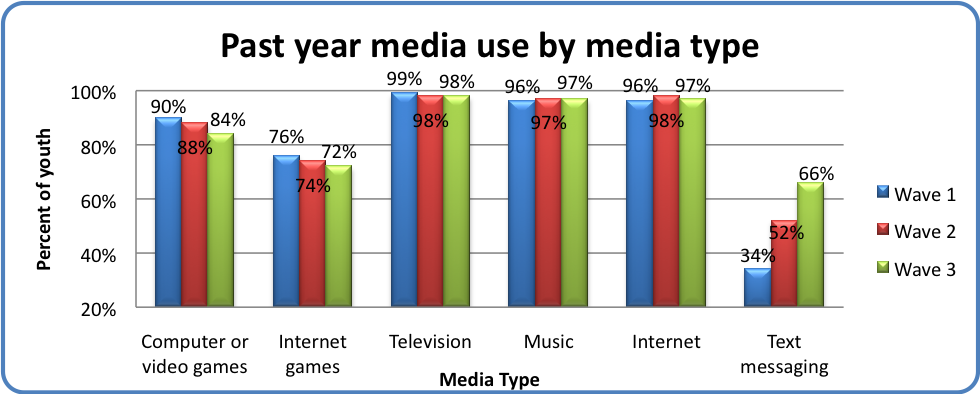
The majority of youth reported using all types of media in the past 12 months.
Almost all youth watched television, listened to music, and used the Internet. Given that youth were required to have used the Internet at least once in the past 6 months to be eligible for the GuwM, it is likely that media use data are higher than would be for non-Internet users.
Use of text messaging was the least common medium used by youth, but also was the one that showed the largest increase over time. This is not surprising given the rapid expansion of cell phone usage and text messaging technology in the same time period (Lenhart, 2009; Rideout, Foehr, & Roberts, 2010). A Kaiser Family Foundation study reports in 2004, 39% of 8-18 year olds owned a cell phone; this increased to 66% in 2009 (Rideout, et al., 2010). In 2006, Pew Internet and American Life Project report 51% of teens 12-17 years of age, regardless of cell phone ownership, had ever sent a text message; by 2008, this was 58% (Lenhart, 2009). This qualification is important: in our study, a small percentage of youth (1%) reported sending and receiving text messages even though they did not own a cell phone. It seems likely that these youth use a family member’s or friend’s phone.
SECTION 2: MEDIA USE PATTERNS BY SPECIFIC MEDIA TYPE
Watching Television:
Two in three youth (64-47%) watch television daily, for an hour or more.
Watching television is a major part of the lives of today’s youth. Of the six types of media use types queried, television was consistently the most commonly used medium over time.
| Television watched in the past year – Child respondent | Wave 1(n = 1,581) | Wave 2(n = 1,195) | Wave 3(n = 1,150) |
| Number of days in a ‘typical week’ | |||
| 7 days | 67% | 67% | 64% |
| 5-6 days | 17% | 14% | 15% |
| 3-4 days | 10% | 12% | 12% |
| 1-2 days | 5% | 6% | 8% |
| 0 days | 1% | <1% | 1% |
| Amount of time in a ‘typical day’ | |||
| More than 3 hours | 26% | 22% | 22% |
| More than 2 hours –3 hours | 24% | 22% | 19% |
| More than 1 hour –2 hours | 32% | 34% | 34% |
| 31 minutes – 1 hour | 14% | 14% | 17% |
| 1 – 30 minutes | 4% | 6% | 6% |
| 0 minutes | 1% | 1% | 2% |
Most youth watched TV frequently and intensely. Indeed, one in four watched TV for more than 3 hours in a typical day. The amount of television consumed in a typical day remained relatively constant use over time.
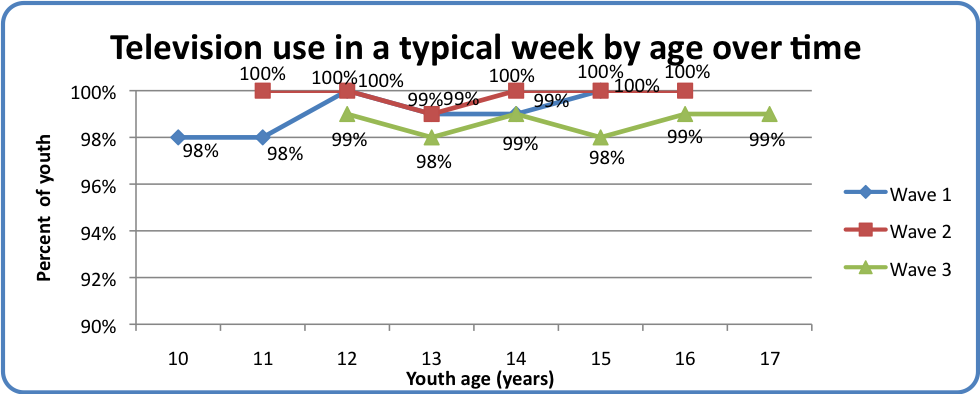
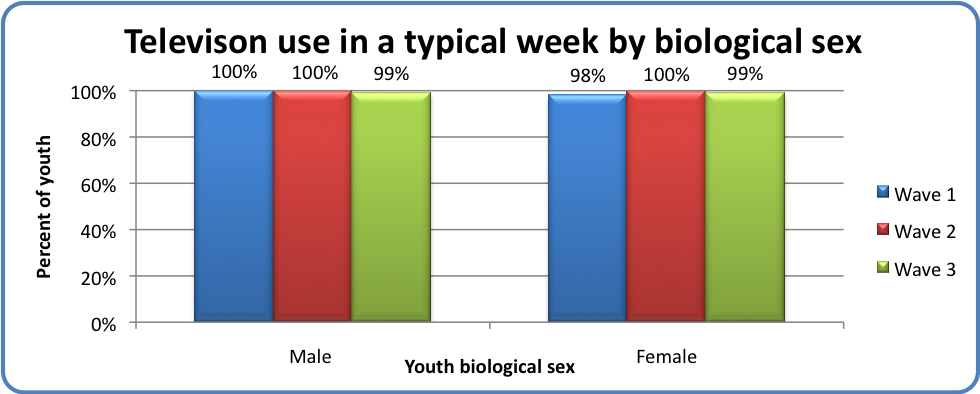
Weekly television consumption was similar for boys and girls, and younger and older youth across the three waves, suggesting that little changed in how young people watched TV as they got older or exposed to other types of media.
Listening to Music:
Compared to television, listening to music was less commonly reported as a daily activity (49-61%).
Interestingly, only half of youth reported listening to music every day. Increases were noted over time, but even then only 61% reported daily music use.
| Music listened to in the past year – Child respondent | Wave 1(n = 1,581) | Wave 2(n = 1,195) | Wave 3(n = 1,150) |
| Number of days in a ‘typical week’ | |||
| 7 days | 49% | 61% | 61% |
| 5-6 days | 18% | 16% | 15% |
| 3-4 days | 13% | 12% | 12% |
| 1-2 days | 15% | 10% | 11% |
| 0 days | 4% | 2% | 2% |
| Amount of time in a ‘typical day’ | |||
| More than 3 hours | 16% | 21% | 20% |
| More than 2 hours –3 hours | 13% | 14% | 14% |
| More than 1 hour –2 hours | 22% | 22% | 26% |
| 31 minutes – 1 hour | 23% | 20% | 20% |
| 1 – 30 minutes | 20% | 20% | 17% |
| 0 minutes | 6% | 3% | 2% |
About one in ten said they listened only one or two days in a typical week. There was a wide range of time youth typically listened to music. Although more than 1 of every 3 youth reported listening to music for more than 2 hours in an average day, about one in five typically listened to music for 30 minutes or less.
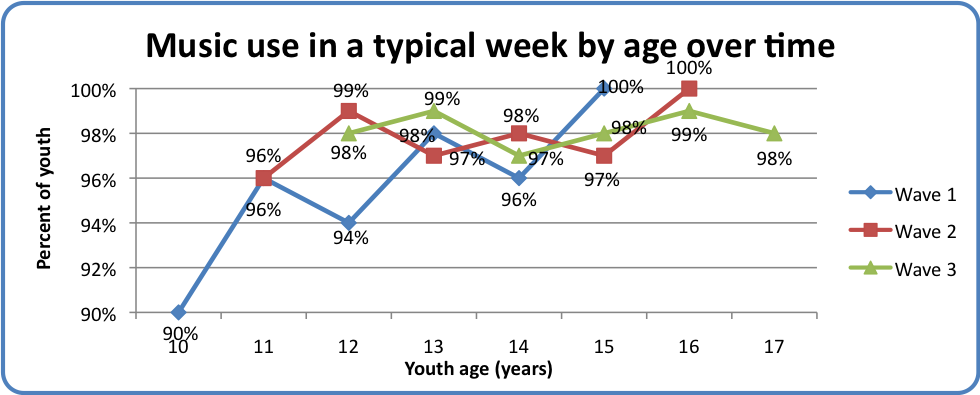
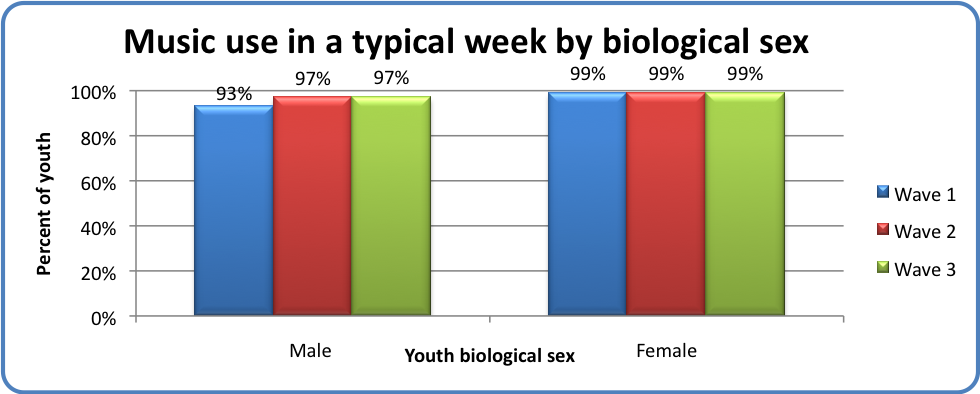
Irrespective of age (Figure above) and sex (Figure below), almost all youth reported listening to music.
